A key focus in Cedefop’s Skills intelligence publication is providing insight into how Covid19 affected employment and skill demand in Europe. This data insight uses the latest available European Labour Force Survey data to shed light on how the pandemic changed employment in the EU and its Member States.
The EU level developments
In 2019 EU employment reached a peak with almost 200 million jobs. A growing population and economic growth resulted in a net increase of more than 12 million jobs since 2011.
Inevitably, the Covid-19 pandemic interrupted the positive trends. In 2020, more than 2.5 million jobs were lost. Unemployment increased, the share of young people not in employment, education, or training (NEET) rose, and fewer adults took part in education and training (see Figure 1).
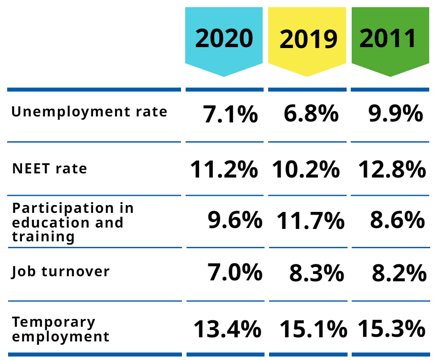 Figure 1: Key labour market indicators development
Source: Skills intelligence indicators based on EU LFS data. Own calculations.
National developments
Of the 29 countries covered by this analysis (the 27 EU Member States plus Iceland and Norway), only Malta, Luxembourg, and Cyprus saw their employment grow. In 8 countries (e.g., Belgium, Greece, Netherlands, Poland, or Slovenia) the employment decline was small (-1% – 0%). In most European Union Member States, including the #DigitalBiblio project partner countries Latvia and Italy, employment fell by more than 1% and in only 4 countries (Bulgaria, Estonia, Spain, and Iceland) employment fell by more than 2% (see Figure 2).
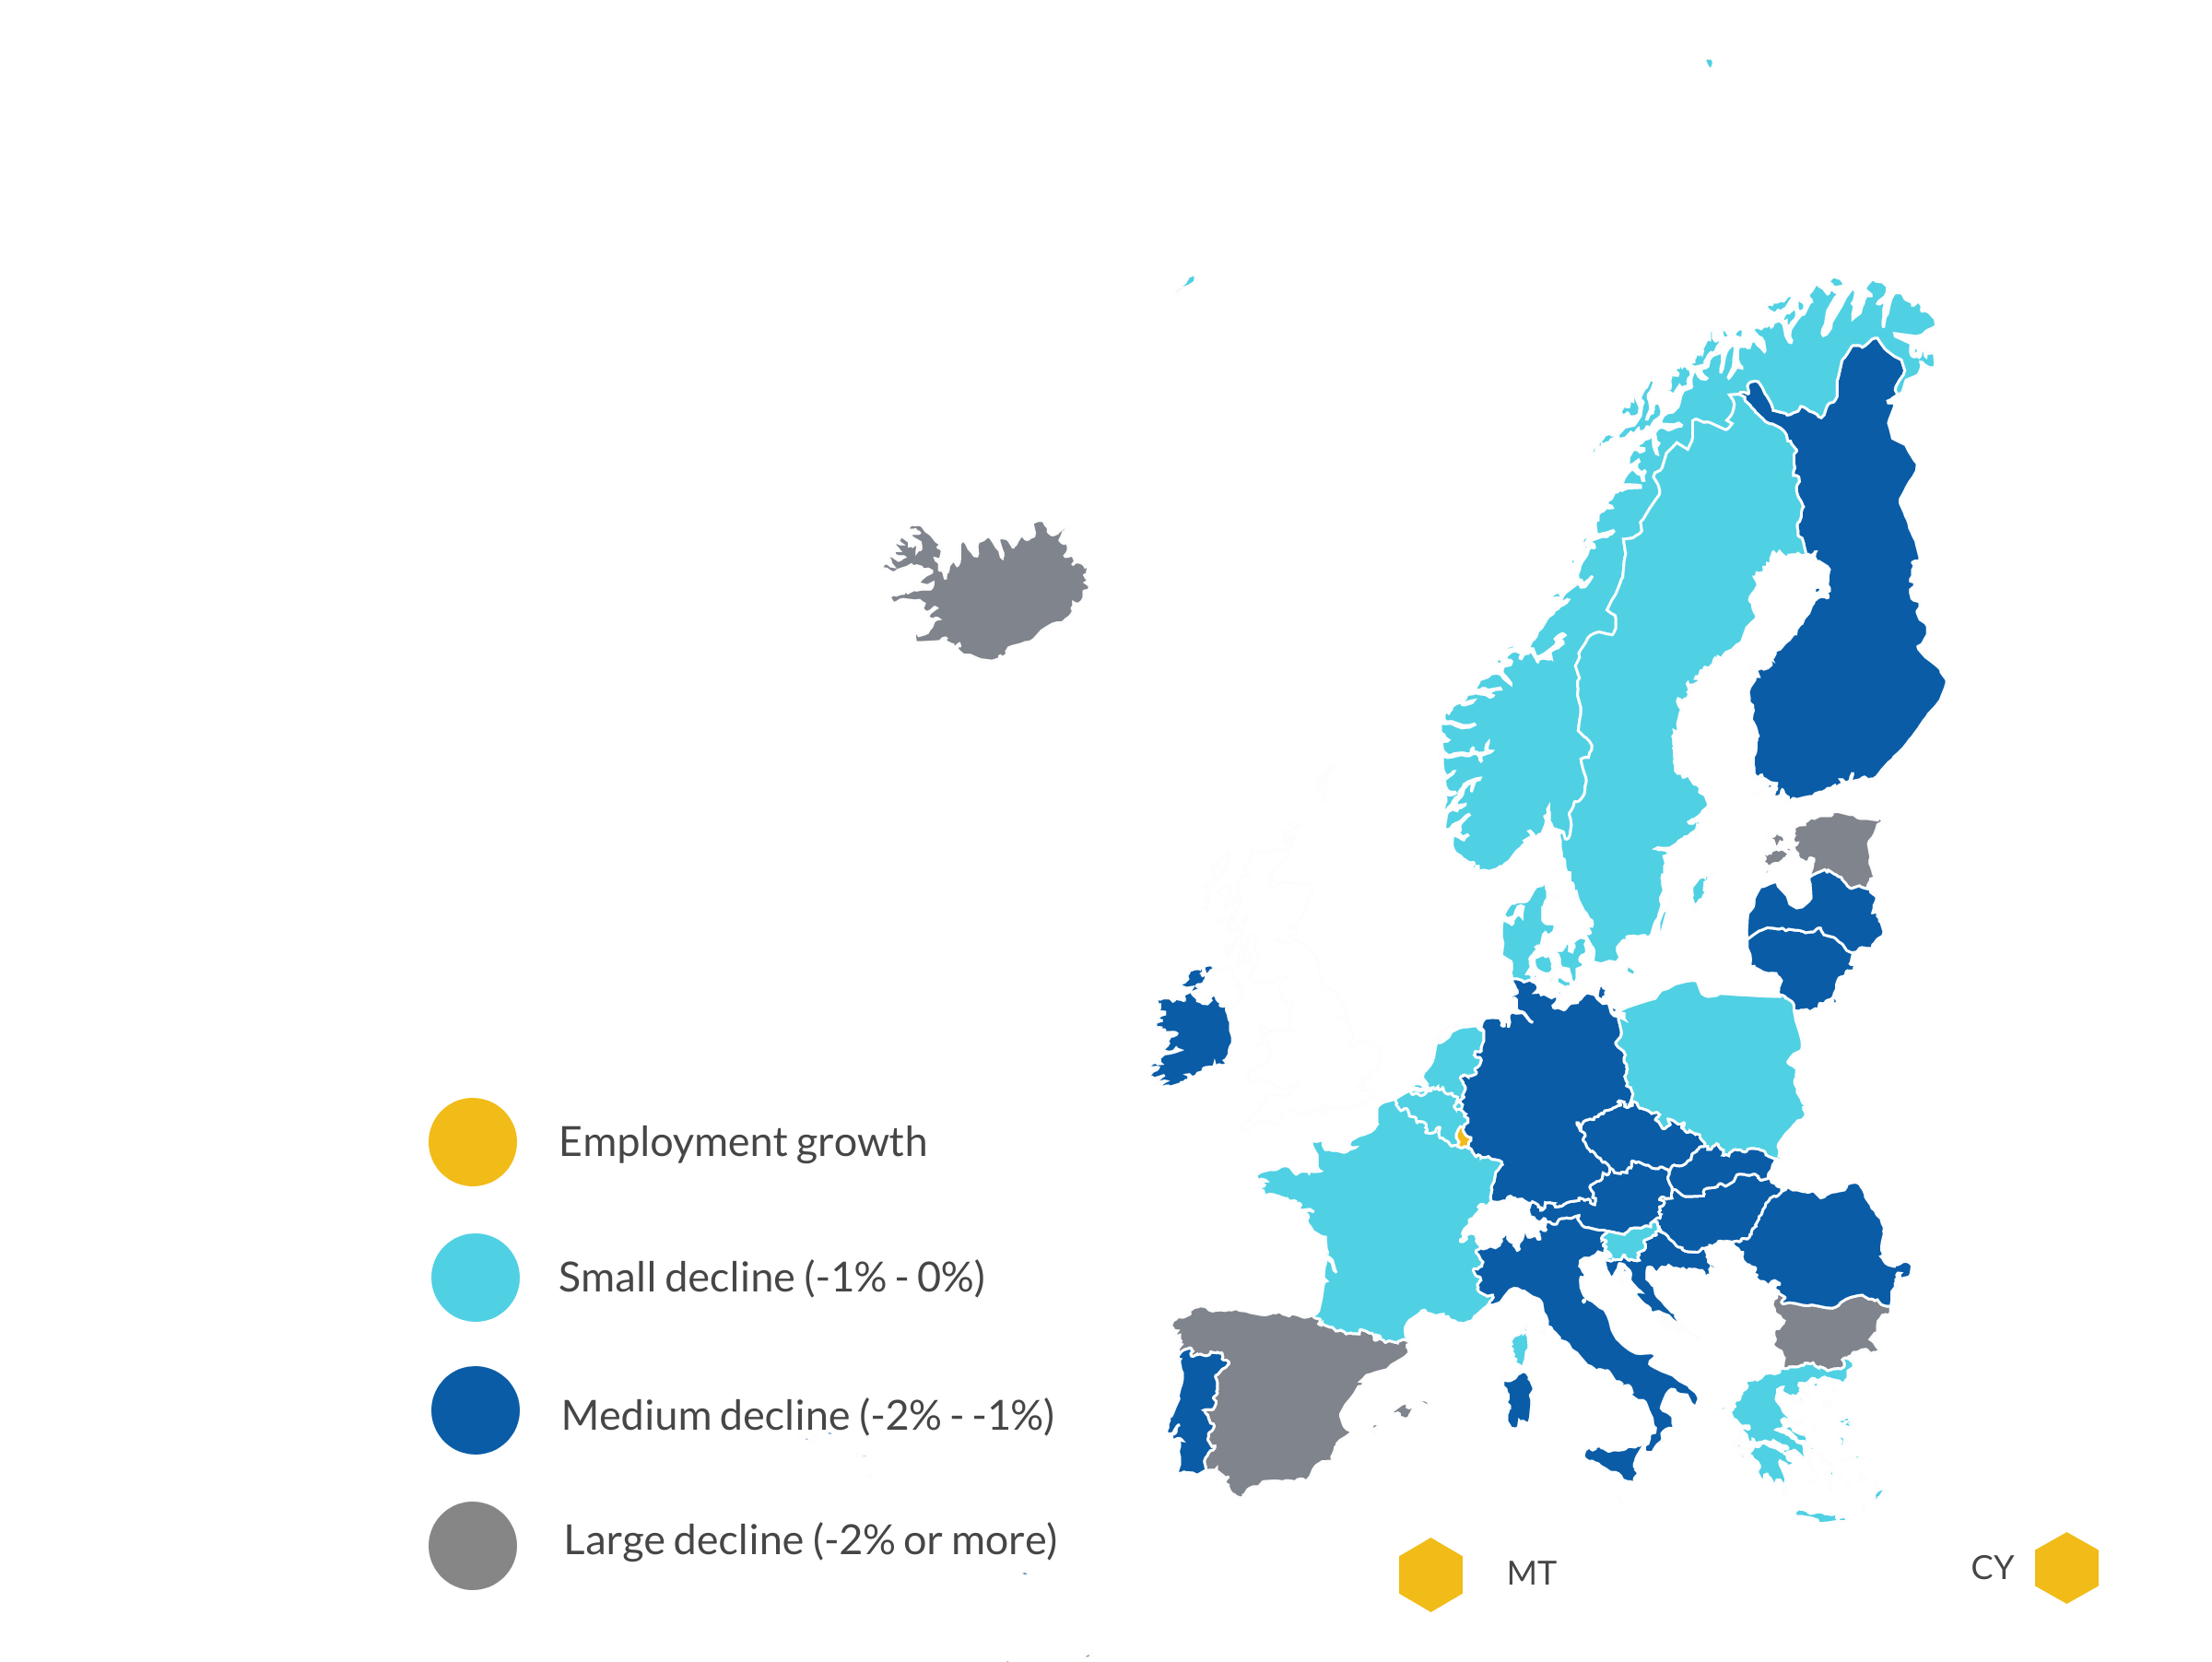
Figure 2: Employment change in Europe (2020 to 2019, in %)
Source: Skills intelligence indicators based on EU LFS data. Own calculations.
Sectoral trends
Job growth in ICT services, energy supply services and public sector & defense helped offset some of the employment losses elsewhere. As quarterly Labour Force Survey data for 2021 is available up to Q3 2021, we can already assess how sectoral employment developed in the second year of the pandemic. ICT services again appear to be the sector with the strongest employment growth (see Figure 3).
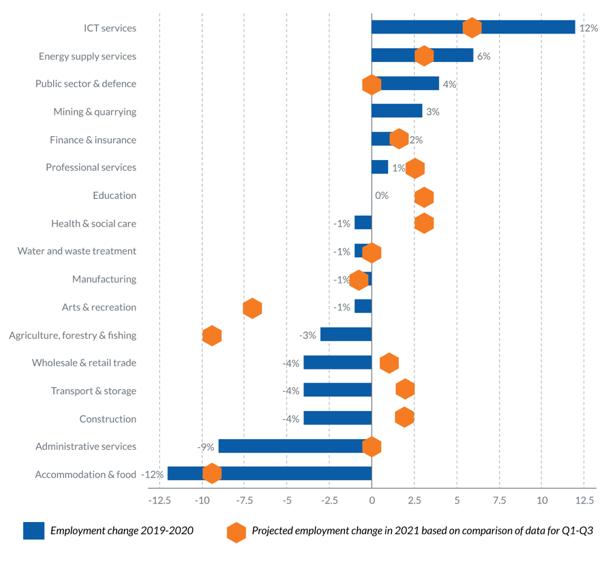
Figure 3: Employment change in the EU by sectors (2019-2020 and projection for 2021, in %)
Source: Skills intelligence indicators based on EU LFS data and LFS main indicators. Own calculations.
Between 2019 and 2020, the total employment of ICT specialists increased by 10%. Employment growth was unevenly distributed across sectors with health and social care gaining the most (+35%). Construction, ICT services, public sector & defense, finance & insurance, and arts & recreation follow with ICT specialist employment growing between 10 and 16%. (Figure 4)

Figure 4: ICT and overall employment change across sectors (in %)
Source: Skills intelligence indicators based on EU LFS data. Own calculations.
Note: Size of a circle indicates the total ICT employment size of the sector. ICT is not a universal remedy: while it certainly contributes to protecting jobs and keeping organizations running, it cannot be deployed everywhere to the same extent and there are practical and financial limitations to how it can be used.
Growing employment in science and technology – occupations central to implementing automation and research and development – and business administration area partly compensated for the occupational employment losses at the medium and lower end of the skills spectrum. This means that alongside shrinking employment, the sector also experienced significant skills, including #DIGITALSKILLS upgrading.
More information on employment trends in the EU and its Member States is available HERE.